Resistance surveys (Bevan 1998; Hargrave et al. 2002; Heimmer and De Vore 1995; Scollar 1990) introduce an electrical current into the ground and measure the ease or difficulty with which the current (measured in ohms) flows through the soil. Cultural features and other localized soil disturbances can be detected if they differ sufficiently from the surrounding soil in terms of their resistance to the passage of the current. The number and mobility of free charge carriers (principally soluble ions) are the primary determinants of electrical resistance. The simultaneous availability of soil moisture and soluble salts determines the free charge carrier concentration in the soil. The mobility of the soluble ions is governed by soil moisture content, soil grain size, temperature, soil compaction, and the surface chemistry of the soil grains (Somers and Hargrave 2001). In situations where the fill of cultural features hold moisture more readily than the surrounding soils, the pits may be manifested by low resistance anomalies. Alternatively, features characterized by relatively coarse or loosely compacted (well-drained) fill may be associated with high resistance anomalies. A pit that is manifested by a high resistance anomaly in one season can conceivably be associated with a low resistance anomaly in other seasons, when relative soil moisture is different. Concentrations of building debris (bricks, stone rubble, etc.) typically exhibit relatively high resistance.
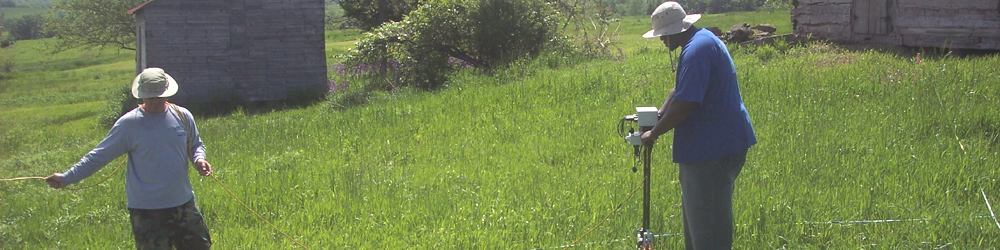
The resistance surveys at New Philadelphia were conducted using a Geoscan RM15 resistance meter equipped with a PA5 probe array and MPX multiplexer. In 2004, the instrument was configured with three probes spaced at .5 meter intervals, generally known as a parallel twin configuration. This probe spacing was selected in order to collect resistance data representative of the uppermost ca. .5 meter of deposits. This depth was selected under the assumption that features would be located immediately below the modern plow zone. In 2005 and 2006, the instrument was configured with two probes spaced at 1.0 meter width. In the resistance surveys undertaken in 2004 and 2005, data values were collected at .5 meter intervals north south along transects spaced at 1meter intervals east west. This strategy produced a relatively high-resolution survey (4 data values per square meter) that should be adequate to detect most features larger than .5 meter diameter.
-- An excerpt from Dr. Michael Hargrave's report of the 2004-2006 Geophysical Surveys at New Philadelphia.

Do you have additional questions? We are also now on Facebook! Follow this link to join in our discussions.

You can also see our Flickr page for geophysical data maps, topographic maps, aerial photographs, and other images, and the opportunity to leave your own comments or questions on them. Use the "Add Note" feature on Flickr to mark-up these data maps and add your own thoughts and comments.